In our current time of economic volatility, social unrest, and political partisanship, simple questions rarely have simple answers. For an owner-operator of a small- to mid-size business, the question of business value in today’s market is increasingly difficult to answer. It is at these times that the team here at HP Accounting feels the need to simplify the process down to the basic premise of what drives value.
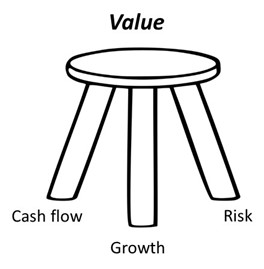
In explaining value, HP defaults to the simple metaphor of value a three-legged stool with key drivers that determine value; cash flow, growth, and risk. A simple but dynamic formula for determining value is the capitalization of a business’ normalized cash flows divided by the difference between the discount rate and a long-term growth rate;
V0 = 𝐶𝐹1/(𝑟−𝑔) where;
Benefit stream (𝐶𝐹) to the owners, normalized
Growth rate (𝑔) expected, long term
Risk (𝑟) involved in receiving the benefits in the amounts and time frames anticipated
This article looks at the key drivers that impact value as they relate to these three inputs.
What are the Key Drivers?
An example of what drives value for a hypothetical company is the best way that we can identify and explain these key drivers. Let us start with a company that makes widgets. Let us assume that a hypothetical stand-alone company WDGT Technology makes them. What drives the value of the business; more specifically the three key inputs to value outlined above?
| Value Driver | Includes … | Discussion of Company |
|---|---|---|
| 1. Management | Experience, Capabilities, Knowledge Base, Trustworthiness, Perceived Management Style, Effectiveness, Mindset Toward Challenges Risk and Opportunities, Growth Oriented, Overall Stability, Personalities, Owner Involvement, Key Person Dependency | Company is owner operated with strong upper and mid-level management teams. Succession plan in place with son in key operations position. |
| 2. Customer Base | Type and Breakdown, Quantity, How Tied to Company, Buying Trends Over 3-5 years, Stability, Turnover, Number of New Customers, Large or Small, Vulnerable to Economic Fluctuations, Gross Margins For Diff. Profit Centers, Ability to Develop Customer Satisfaction and Loyalty | Strong customer base selling to beer industry but niche product hasn’t caught on with coffee and soft drinks. Number of customers is small with customer concentration (top 3 customers represent 67% of sales). |
| 3. Competition | How to Deal With It, Competitive Advantages, Specific Niches Within Industry, Barriers to Entry From Local/National/Global Competitors, Offensive or Defensive Mechanisms in Place | Unique and proprietary delivery system but others products that produce similar results (burst of nitrogen into beverage). Barriers to entry are high due based on relationships with aluminum can and bottle producers. |
| 4. Financial Performance | Growing, Stagnant, Declining, Recurring Revenue, Clean Books or ‘Dirty’, Up to Date, Reliance on Controllers & CPA’s, Ability to Interpret Financial Statements, Partnership with Consultants, Operating Efficiencies, Internal Systems | Strong steady top- and bottom-line growth. Large customers help provide economies of scale to maximize margin on remaining business. Financial statements reviewed. Strong internal finance team. Above average gross and operating margins. |
| 5. Sales, Marketing & Distribution | Clearly Defined strategy, Any Rainmakers, How Many, Efficient, Ability to Expand Any or All, Technology or Labor Intensive, Protected Areas, Distribution Rights, Supply Chain Partnerships, Synergistic products | Strong salesforce and high-touch customer service, especially with top 3 customers. Strong supply chain partnerships with aluminum and bottle manufacturers that provide a synergistic product (WDGT InsideTM). |
| 6. Industry & Market Conditions | General Tends Within Market or Industry, Market Position, Any Competitive Advantages, Foreseeable Future, General Economics, Industry Economics, Market Conditions, Ongoing Competition Strategies | Craft beverage market is booming at the expense of traditional brands. Competitive advantage is distribution relationships. Ongoing strategies include branding into other craft beverage categories and possible consolidation of the industry under the WDGT umbrella. |
| 7. Asset Quality | TANGIBLE: Amount of Deferred Maintenance, (Premise & FFE), Type and Age of Technology/IT, Premise Condition, Age of Inventory, Age and Quality of Rolling Stock INTANGIBLE: Patents, Trademarks, Copyrights, Proprietary Processes, Community Reputation, Regulator History, Recognizable Brands | Significant investment in tangible assets including a state-of-the-art production facility in the Midwest and satellite integration hubs at aluminum can and bottle sites. Several trademarked brands and patented product and process. Strong working capital position industry best days receivable and inventory turns. |
| 8. Product / Service Diversity | One Product or Multiple, Brand Recognition of Products, Risk Position of Major Product(s), Any Related Products That Could ‘Piggy-back’, General Level of Risk Associated With Product or Service, Investment in R&D | Increased risk in niche product instead of a portfolio of other products. Strong R&D investment to develop next generation product that is smaller, less expensive and easier to integrate into other craft beverages. |
| 9. Growth Plan | Offense or Defense in Place to Cope With New Economy and Industry Trends, New Products/Services, Adaptability, Patents, New Industry Knowledge & Concepts, Level of Intellectual Property | Opportunities to grow business beyond WDGT with its New Product Division tied to R&D. Possible expansion of brand and products through acquisition. |
| 10. Capital Strategy / Resources | Ability to Generate Cash and Grow with Earnings, Established Lines of Credit, Solid Financing Strategies, Available for Growth, Satisfactory Levels of Debt, General Capital Efficiency | Strong balance sheet with excess lending capacity to allow company to fund acquisitions with cheap debt. Lower cost of capital helps mitigate acquisition and internal expansion risk. |
For assessing value, HP has a master list of 26 key value drivers that dive into very specific detail. We have narrowed down this list to the top 10. These 10 drivers help a valuation expert
understand the business model, operating history and growth story surrounding the business. This understanding provides the expert support for key assumptions that drive value using the formula above such as long-term growth rate, discount rate, gross and operating margins, balance sheet and incomes statement adjustments. They also help the expert narrow in on a universe of similar transactions that help narrow down comparable exit multiples that get applied to the company’s operating metrics.
The list below looks at these 10 key drivers, what is included in the analysis of each and our assessment of they impact the valuation of WDGT Technology.
The above discussion is just one of many steps in a valuation expert’s process for determining value. However, these 10 key inputs drive the appraiser’s due diligence and set the building blocks for the analysis and report that identifies, supports, and opines to value.
Please contact us to help with your valuation questions: